Seven steps at 85% each is a 32% agent, and mine ran worse
0.85 to the seventh is 0.3206, and no prompt or model upgrade changes it. My seven-node cart agent modelled at 48% end to end and ran at about one in five. The gap is the useful part.

On this page
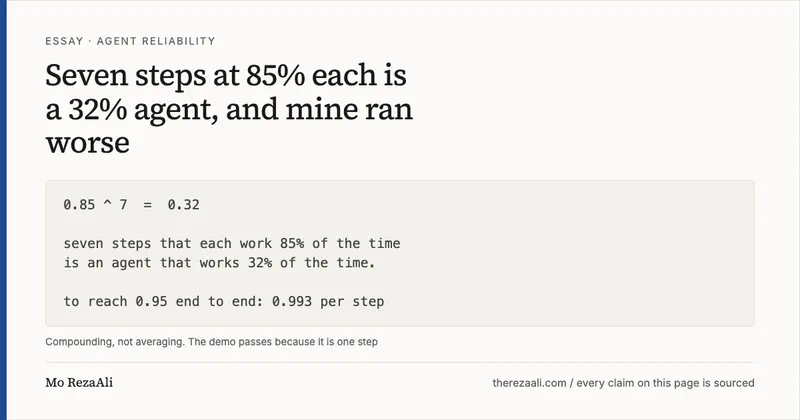
Seven steps at 85% each is a 32% agent. Ten steps is 20%. Those two figures are exact: 0.85⁷ = 0.3206 and 0.85¹⁰ = 0.1969. No prompt, no model upgrade and no platform changes them, because per-step success rates in a chain multiply instead of averaging.
I built a seven-node abandoned-cart agent in a visual workflow builder and it passed its demo on one test cart. Then I pointed it at a real day: 140 abandoned carts, of which maybe 30 came out the other end handled correctly. About one in five, by my own rough count that night, and I want to be precise about how imprecise that is. I was reading a CRM, not a log table. It is my own unaudited figure from my own work, published here before this site existed. There is no execution log to link, so this one rests on my account of it.
One customer who abandoned a $12 phone case got a “complete your premium order” SMS carrying a 15% discount code I never meant to issue to anyone. That class of send ran for about two weeks before I caught the pattern. Call it a couple hundred dollars in discount codes handed to people who were not buying. Every node in that chain reported success.
I blamed the model first and swapped to a bigger one. Same mess, slightly more expensive. The hypothesis was wrong, and the arithmetic below says by how much.
The arithmetic, and the assumption it rests on
The model here is not new and it is not mine. It is the series-system reliability formula, and the NIST/SEMATECH e-Handbook states it in section 8.1.8.2 as R_S(t) = ∏ R_i(t): multiply the reliabilities. The handbook also states the condition that makes it valid, and this turns out to be the whole story of my agent: “Each component operates or fails independently of every other one, at least until the first component failure occurs.”
Hold onto that condition. It is the one my agent broke.
The worksheet, and what those numbers actually are
Here is the flow with a rate against each node. Read this before the table, because it changes what the table is: these are not logged measurements. I did not instrument per-node success at the time. They are my estimates, assigned after watching the thing fail, and by my own admission in the original post I was being generous on a couple of them.
Table: My seven-node abandoned-cart flow with retrospectively estimated per-node success rates, and the running product. The rates are my estimates rather than measurements; the running total is arithmetic on those estimates.
| Step | Node | Estimated per-step success | Running product |
|---|---|---|---|
| 1 | Read cart contents | 0.97 | 0.9700 |
| 2 | Classify buyer intent | 0.78 | 0.7566 |
| 3 | Pick the right offer | 0.88 | 0.6658 |
| 4 | Draft the email | 0.92 | 0.6125 |
| 5 | Draft the SMS | 0.92 | 0.5635 |
| 6 | Schedule the send | 0.95 | 0.5354 |
| 7 | Log result to CRM | 0.90 | 0.4818 |
Modelled end to end: 48%. For a flat rate applied to any chain length, the curve looks like this.
Table: End-to-end reliability of a chain of independent steps, by chain length and uniform per-step success rate.
| Steps | @95% | @90% | @85% |
|---|---|---|---|
| 3 | 86% | 73% | 61% |
| 5 | 77% | 59% | 44% |
| 7 | 70% | 48% | 32% |
| 10 | 60% | 35% | 20% |
The model under-predicted the failure, and that is the finding
My original post said the ten-step figure of 20% matched my night at the CRM almost exactly. It does not, and the mismatch is worth more than the match would have been. My agent had seven steps, not ten. My two models of it predict 32% (flat 0.85) and 48% (the worksheet). What I published was one in five. Both models were optimistic, one of them by nearly thirty points.
Two derivations pin the gap. Both are this article’s arithmetic on the one rate I published, not a second measurement, and they inherit its looseness: I counted “maybe 30” out of 140 off a CRM screen and called it one in five, so treat 0.20 as a round number and not a reading. To land at 20% with a uniform 0.85 per step you need ln(0.20) / ln(0.85) = 9.9 steps, so the 20% figure describes a chain I did not build. And a seven-step chain finishing at 20% implies a uniform per-step rate of 0.20^(1/7) = 0.795, not 0.85.
Three mechanisms account for the difference, and each one generalises.
A node on the canvas is not a step in the chain. “Classify buyer intent” is one box and at least three failure surfaces: the model call, the parse of whatever came back, and the schema or enum check that decides the label is usable. Count failure surfaces, not boxes, and my seven-box flow was closer to ten steps than seven. The multiplication was right. My count of what to multiply was wrong.
The independence assumption does not hold. NIST is explicit that the product formula needs each component to fail independently of every other one. A cart record with a malformed line item does not fail one node. It degrades the read, poisons the classification and misprices the SMS, all from one cause. Correlated failure makes the real distribution more bimodal than the product of independent rates suggests: batches come out mostly fine or mostly wrecked rather than uniformly degraded. The product is a fair planning tool and a poor description of the variance.
Estimates made by the person who built the thing run warm. The 0.795 above sits five and a half points under the 0.85 flat default, and about ten points under the 0.901 geometric mean of the rates I actually wrote in the worksheet (0.4818^(1/7)). The generic default was optimistic. The rates I picked node by node, after watching the thing fail, were about twice as optimistic as the generic default I had not bothered to think about.
Google’s SRE team published the sharpest correction to naive chain multiplication I have found, in The Calculus of Service Availability (ACM Queue, March/April 2017). Their starting rule is mine: “A service cannot be more available than the intersection of all its critical dependencies.” Then they call the inference that each extra link needs another 9 “incorrect”, because a dependency appearing at several points must be counted once. Their rule: “If a service has N unique critical dependencies, then each one contributes 1/N to the dependency-induced unavailability of the top-level service, regardless of its depth in the dependency hierarchy.”
Applied to my flow, my classify-intent node is not step two of seven. It is a critical dependency of steps three through seven, which is why one wrong label produced five confident successes carrying a wrong answer. Count unique critical dependencies, not boxes.
Why that node and not another
The rates in the worksheet are uneven and the split is not random. Reading a cart is 0.97 and hitting a scheduler is 0.95 because both are plumbing: deterministic, checkable, the same every time. Classifying why someone abandoned is 0.78 because it is a judgment call made in one pass with no way to ask a follow-up question. Price shock. Just browsing. Payment failed. Distracted. Comparison shopping. Accidental add. My agent would read a cart holding one cheap item, decide “high purchase intent, price-sensitive” and fire a discount at someone who was never buying, who then learned that abandoning carts prints coupons. That is where it snapped in every batch I looked at, and I have not seen a classification node of that kind sitting at 95%.
Why it fails green
The worst property of this failure is not the rate. It is that nothing turns red.
That is a documented property of the tooling, not a quirk of my build. n8n’s error handling documentation says the error workflow “runs if an execution fails”, and gives the usual causes as “errors in node settings, or the workflow running out of memory”. The only way to make a workflow fail deliberately is the Stop And Error node, which the same page documents as a way “to force executions to fail under your chosen circumstances”. That is a statement about the world model the platform holds: an execution either errors or it does not, and semantic correctness is not an observable. A node returning “high purchase intent, price-sensitive” for someone who was browsing has succeeded by every definition the runtime has.
One layer down, the reason the model produces a confident wrong label rather than declining is also documented. Why Language Models Hallucinate (Kalai, Nachum, Vempala and Zhang, September 2025) argues that models hallucinate “because the training and evaluation procedures reward guessing over acknowledging uncertainty”, and that they “originate simply as errors in binary classification”. That is why a bigger model does not fix it. A bigger model is optimised by the same scoring that pays for a confident guess and charges nothing extra for a wrong one.
The failure category also has a name. Why Do Multi-Agent LLM Systems Fail? (Cemri, Pan, Yang et al., Berkeley, revised October 2025) built a taxonomy from 1600+ annotated traces across 7 frameworks, developed from 150 traces under expert annotation at an inter-annotator agreement of kappa = 0.88. It lands on 14 failure modes in three categories, and the third is task verification. Their conclusion is that these failures “require more sophisticated solutions”, not better models.
Why you cannot out-model a long chain
My original post got this argument right and the arithmetic wrong, and correcting it makes the point harder. I wrote that a better model might move a node from 0.85 to 0.90, and that across ten steps this takes you from 20% to 35%. It does not. Upgrading one node in a ten-step chain gives 0.85⁹ × 0.90 = 0.2085. Twenty percent to twenty-one percent. The 35% figure is 0.9¹⁰ = 0.3487, which requires every node in the chain to improve. One better node buys you one point.
The published evidence points the same way. METR’s Measuring AI Ability to Complete Long Software Tasks (arXiv 2503.14499, v4 revised 10 July 2026) puts frontier models at a 50%-task-completion time horizon “of around 50 minutes”, doubling “approximately every seven months since 2019”, and attributes the increase “primarily” to “greater reliability and ability to adapt to mistakes”. Length is the binding constraint and reliability is what moves it. Those are software engineering tasks with expert human baselines, so take the direction, not a number for a marketing flow.
tau-bench (Yao, Shinn, Razavi and Narasimhan, June 2024) introduced pass^k, the probability that all k independent trials of the same task succeed, and reports that “even state-of-the-art function calling agents (like gpt-4o) succeed on <50% of the tasks, and are quite inconsistent (pass^8 <25% in retail)”. That is my multiplication run across repeated trials instead of across steps, by researchers, with a metric that has a name.
It is also the honest limit on my planning number. I use 85% as the default for a fuzzy step and 94% or better for a deterministic one, and that is an assumption rather than a citation. tau-bench measures whole episodes, so it supports “chains degrade fast” and does not establish that any given LLM step sits at 85%. I could not find a public benchmark reporting per-step success for a node like “classify why this person abandoned a cart”. Instrument your own nodes and use your numbers over my default.
Retry, and why it does not save you
The obvious objection from anyone running these flows is that the platform retries. n8n documents per-node Retry on Fail, Max Tries and Wait Between Tries (ms) in node Settings. That page describes the mechanism and states no default value for either number, so the retry budget is a choice you make rather than one the page makes for you.
Retry then partitions the chain along the same line everything else in this piece does. For an independent transient failure it is close to free reliability: a plumbing step at p = 0.95 with three tries gives 1 − (1 − 0.95)³ = 0.999875. For a judgment step the error is largely deterministic given the same input and the same prompt, so retrying returns the same wrong label with the same confidence and the effective rate stays at 0.78. Retries fix plumbing and do nothing for judgment.
The one technique I know of that raises a judgment node without a human and without a bigger model is sampling the step several times and taking the majority answer. Self-Consistency (Wang et al., 2022, revised 2023) reports +17.9% on GSM8K and +6.4% on StrategyQA doing exactly that. Those are 2022 reasoning benchmarks, not intent classification, so it is a mechanism to test rather than a promised lift, and n samples costs n times the tokens for that step.
How to detect this in your own flow
The test takes ten minutes and needs no tooling.
- List every failure surface, not every box. A node that calls a model, parses its output and validates a schema is three rows.
- Assign each row a success rate you would bet your own money on, not the rate from your best demo run. Mark each row JUDGMENT or PLUMBING.
- Multiply down the column. That product is your optimistic ceiling, not your expected result, for the three reasons above.
- For each row, ask whether a wrong output fails loud or fails green. Every green-failing row is invisible to your platform’s error handling and needs a gate you wrote yourself.
- Mark which rows are critical dependencies of downstream rows. Those are where one error multiplies into several confident successes.
For the empirical version rather than the estimate, log the input and output of every node for one real batch and score a sample by hand. That is what I did not do before shipping, and it is the difference between a worksheet and a measurement.
Design so it cannot recur
Delete steps before you optimise them. Cutting my flow from seven steps to five, by removing the standalone SMS-draft node and folding CRM logging into the send step, takes the modelled 0.97 × 0.78 × 0.88 × 0.92 × 0.95 to 0.5819. Forty-eight percent to fifty-eight, holding the same per-step rates. But the two moves are not equivalent and my original post glossed over it. Deleting work is an unconditional gain. Merging work is conditional: the send step now does two jobs, and holding its rate at 0.95 is an assumption I have not tested. Merging only pays if the merged node does not absorb the failure rate you thought you removed.
Put the human on the weakest number and nowhere else. One checkpoint, at classify-intent. The agent drafts everything and parks the batch. Each morning I spend about eleven minutes scanning intent labels and the offers attached to them, approve, fix the handful that are wrong, and release. The whole flow by hand used to take two hours. Both are my own unaudited figures from my own work, in the same post linked above. Automation moved the judgment. It did not remove it.
Gate what a rule can check. Two of mine: an offer that is a discount over 20% on an order under $20 gets blocked and flagged, and an SMS carrying a price that does not match the cart gets blocked. These are if-statements. They make no model call and cost no tokens per run.
The arithmetic of a gate is worth writing down, because my original post asserted the effect without the formula. For a node with success rate p and a gate catching a fraction d of its errors, effective correctness is:
p' = p + (1 - p) * d
On my weakest node, p = 0.78: a gate catching 70% of errors gives 0.934, one catching 90% gives 0.978. Two conditions travel with that formula or it lies to you. It only holds if caught errors are then corrected; if they are merely blocked and dropped, precision rises, throughput falls and end-to-end success does not improve at all. Mine are corrected, by me, in the eleven minutes. And my two rules are value-range checks that catch the loud subset of a silent failure class. Neither catches “wrong intent label, plausible offer, correct price”, which is the failure that cost me the fortnight.
The demo is one trip down the chain on a clean input. The system is the same chain on real volume, where the weakest node decides the outcome and reports success the whole way down. Before the next one ships, run the column. If the number scares you, that is the column doing its job.
Sources
Every source below was opened and checked on the date shown. Links open in this tab.
- 85% Accurate, 20% Reliable: The Math That Explains Why Your AI Agent Keeps Breaking Mo RezaAli on X x.com Accessed 6 August 2026
- 8.1.8.2. Series model, NIST/SEMATECH e-Handbook of Statistical Methods NIST/SEMATECH www.itl.nist.gov Accessed 6 August 2026
- The Calculus of Service Availability ACM Queue, March/April 2017, Treynor, Dahlin, Rau, Beyer (Google SRE) sre.google Accessed 6 August 2026
- Handle errors gracefully n8n Docs docs.n8n.io Accessed 6 August 2026
- HTTP Request node common issues n8n Docs docs.n8n.io Accessed 6 August 2026
- tau-bench: A Benchmark for Tool-Agent-User Interaction in Real-World Domains arXiv 2406.12045, Yao, Shinn, Razavi, Narasimhan arxiv.org Accessed 6 August 2026
- Why Do Multi-Agent LLM Systems Fail? arXiv 2503.13657, Cemri, Pan, Yang et al. arxiv.org Accessed 6 August 2026
- Why Language Models Hallucinate arXiv 2509.04664, Kalai, Nachum, Vempala, Zhang arxiv.org Accessed 6 August 2026
- Measuring AI Ability to Complete Long Software Tasks arXiv 2503.14499, Kwa, West, Becker et al. (METR) arxiv.org Accessed 6 August 2026
- Self-Consistency Improves Chain of Thought Reasoning in Language Models arXiv 2203.11171, Wang, Wei, Schuurmans, Le, Chi, Narang, Chowdhery, Zhou arxiv.org Accessed 6 August 2026